
When Queen Elizabeth II was born in 1926, average farmland values in the UK were £30 per acre, today this figure is £8,000 per acre.
1930s
Land prices hardened between 1932 and 1938 following the establishment of UK Marketing Boards in 1931 and the introduction of subsidies and grants.
1940s
The Second World War (1939-1945) created the need for greater output resulting in a 50% increase in arable area, guaranteed prices and assured markets. All this brought a revival of interest in agricultural prospects with a ‘sellers’ market being established for vacant possession land.
1950s
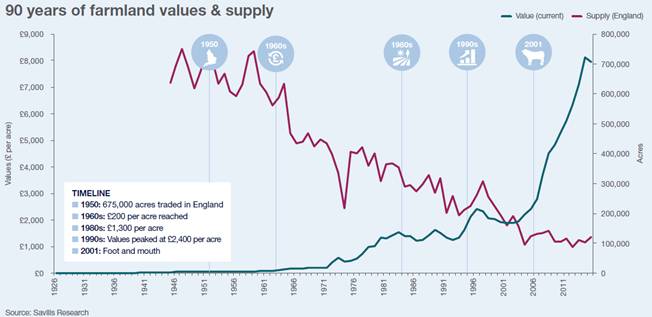
In 1950, 675,000 acres were traded in England, since when the traded volume has gradually declined and in 2000 had reduced by 70% to around 200,000 acres. 1952-1958 saw stable vacant possession prices of around £80 per acre.
1960s
During the 1960s values rose steadily to just over £200 per acre, the start of 30 years of a steady growth in values.
1970s
This rapid growth was dampened in 1973/74 when inflation topped 24% and interest rates reached 12%. The price of wheat rose fourfold during the 1970s from £27 per tonne in 1970 to £105 per tonne in 1980.
The UK joined the EU in 1973.
1980s
Wheat prices remained above £100 per tonne and average farmland values remained relatively stable. Milk quotas and Environmentally Sensitive Area schemes were introduced during this period.
1990s
Average values fell during the early 1990s as interest rates reached 15%, but recovered in the mid 1990s, peaking at over £2,400 per acre as profitability increased on the back of high wheat prices.
During this period the property market was buoyant and prime country houses rose at around 10% per annum. Farming fortunes plummeted in the following years as wheat prices fell to below £60 per tonne.
2000s
In 2001 the industry was hit by foot and mouth disease and incomes continued on a downward trend. In 2003 non-farmer (lifestyle) buyers peaked at 45% of all buyers and this was the beginning of a weakening relationship between values and productivity as demand becomes more diverse.
In 2005 CAP Reforms (Single Farm Payment) introduced. 2008 saw the Credit Crunch. Wheat price reached £180 per tonne. The recession caused by the credit crunch continued the trend of rising values as investors turn to farmland as a safe haven. And in 2009 BoE cuts interest rates to 0.5%, the lowest level for 135 years.
2010s
Arab Spring in 2010 saw the oil price peak at over $110 per barrel. In 2012 wheat prices were over £200/tonne. Gold peaked at over $1,660/ounce. At 131,000 acres, the amount of land publicly marketed across Great Britain during 2014 was the smallest since records began in 1995. Wheat prices fell to below £120 per tonne in 2015 resulting in the first signs of pressure on values for 13 years.
During the 10 years to 2014, average farmland values had increased by 277% and the average supply of farmland publicly marketed was just over 130,000 acres.
According to Savills most recent analysis of the market, average land values fell by -0.4% during the first quarter of 2016 with a lack of transactional evidence leading to a number of regions recording no change in values. There currently appears to be little correlation between the levels of supply and change in land values at a regional level except in the East Midlands where supply increased by two thirds compared with the same period of 2015 and values decreased.
Looking ahead exceptional prices may still be achieved if all the right factors come together, but conversely it is very likely that there will be more farms where potential sales fail to meet expectations.
Chris Spofforth, Savills head of farm agency in the South East, said: “We expect values in the future to be much more varied with markets becoming localised.”