
This year rather than look at the good ones, ignore the bad ones and then put them in a draw never to be seen again, consider how this data can be used to make changes that will improve next year’s profitability, is the advice from Charles Wright, Farmacy agronomist in the East Midlands.
Where poor areas can be identified this year compare these with the historical ‘field performance’ – but remember that in such a difficult season it’s important not to jump to conclusions, he says.
“However, if historical performance has been poor and this has been born-out again, why assume 2019 will be any different?”
“It’s really important to understand better where the profit or loss is coming from within a field and manage this accordingly – this could mean managing higher yield potential areas to push for even higher yields if they are not treated as the field average.”
“Conversely in the higher performing areas of the field is there anything limiting even better performance and could these areas be improved?
“Doing this in a coherent and effective way that considers all of the factors that may be affecting that particular field or area of the field is the challenge – but one that Omnia’s unique field performance mapping facility overcomes.”
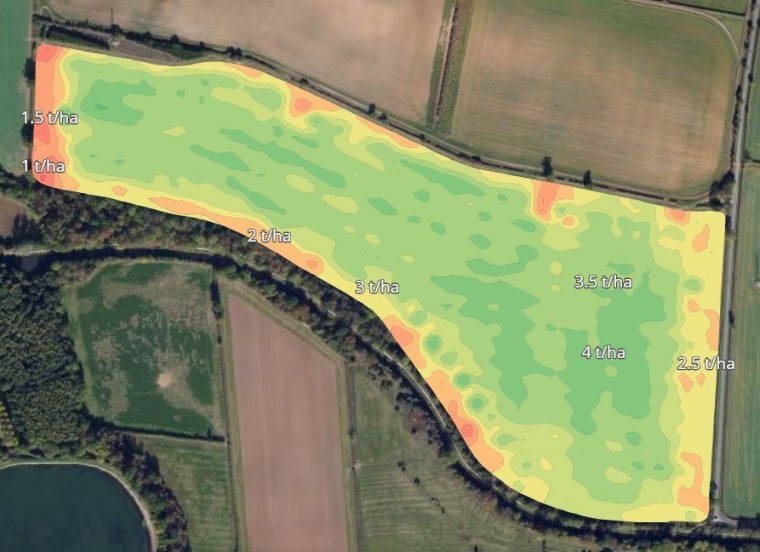
Using Omnia yield performance mapping, it’s possible to identify and map areas of fields by categorising them in terms of the consistency of performance such as poorly consistent yield, good consistent yield etc- and adapt crop management accordingly.
This is exactly what Charles has done with one of his clients J & S Bealby, Lodge Farm, near Grantham in Lincolnshire.
“Yield maps in 2018 confirmed a poor performing headland due to a combination of heavy soil and high shading from woodland,” he points out. “This area will now form part of a mid-tier stewardship scheme planned for 2019. Income from Stewardship on this strip will make a positive contribution to the farm profit, rather than the loss from cropping it.”
Across the rest of the field Charles will focus on using variable seed rates to create more even plant establishment.
“I want to start with the basics, before I move on to fine tuning with nutrition– at this stage the ultimate aim is to have the correct number of plants established.”
“Using Omnia I can input information such as soil type, seedbed conditions, weed and slug pressure, on top of which the variable seed rate plan can be created.”
“I can also tweak this if needed by comparing this to the yield maps, so if they suggest previous seed rates were still too low I make further adjustments. Without a more uniform plant stand you are always playing ‘catch up’ and have already lost potential.”
So before you put your yield maps back in the draw for another year, think about how to use this valuable data about your fields to help you make the right cropping decisions for the coming season.