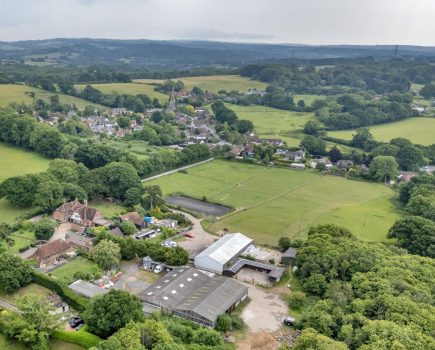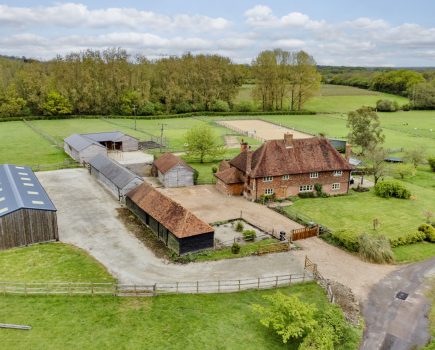
Strutt & Parker research shows farmland is selling more quickly than it has over the past five years
Farms and estates are being snapped up by buyers more quickly than for several years as demand continues to outstrip supply.
Analysis of Strutt & Parker’s Farmland Database, which records the details of all farms, estates and blocks of publicly marketed farmland over 100 acres, shows that nearly half of the farms marketed this year are already either under offer or have exchanged. This is a much greater proportion than was seen at the equivalent point in each of the past five years.
Tight supply and strong demand have pushed the average value of arable land in England up by 2% to £9,600/acre – the highest it has been since 2015. The average value of pasture land has also risen by 6% to £7,900/acre.
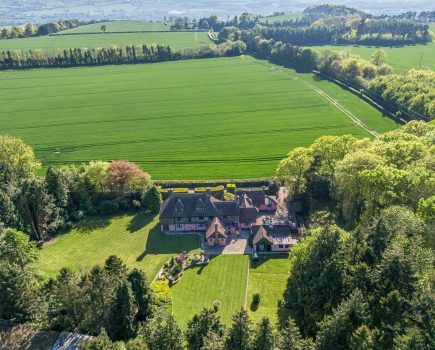
“We haven’t seen a farmland market like this for some time,” says Matthew Sudlow, Head of Estates & Farm Agency for Strutt & Parker. “Competitive bidding and best-and-final offers are becoming common for top-quality properties in desirable locations. For example, a 500-acre farm on the market recently for £7.25m attracted viewings from 17 interested parties and went under offer, after just five weeks, for more than its guide price, following a call for best-and-final offers.”
Supply is growing, with 43,400 acres publicly marketed in the first half of 2022, which is 12% more than in 2021 and 11% up on the five-year average. However, most of this rise can be attributed to a small number of significant sales in the Eastern counties, rather than a rise in the number of farms being marketed. There are more farms than usual available in northern England, although the majority of farms for sale are in southern England where there are slightly less available than on average. The total number of farms publicly available so far this year – 121 – is only the same as the five-year average.
“Even if we consider the number of farms available privately, the volume of land available is, in most locations, still not high enough to meet demand,” says Mr Sudlow. “Demand remains robust because of the broad spectrum of buyer types wanting their own slice of the countryside – from farmers with rollover money, to lifestyle buyers and green investors looking to invest in natural capital.”
Looking forward, there are no signs of demand dropping. Indeed, in times of economic uncertainty, there tends to be a flight to land from wealthy individuals and private investors because people see it as a safe haven for their wealth and a hedge against inflation, he says. Farmland may only deliver modest annual returns, but it is an attractive investment vehicle, being a tangible asset that can be enjoyed, while also offering tax benefits and potential for capital appreciation.
Mr Sudlow says it is anticipated that supply will continue to steadily increase. “We are certainly having a growing number of conversations with farmers with no successor who are currently considering a retirement sale. For those who are already considering a sale, it makes sense to take advantage of the strength of the market, particularly given the backdrop of rising input costs and volatile commodity prices, and the availability of the lump-sum scheme. However, while we expect total supply in 2022 to be up on 2021 levels, in historic terms volumes are likely to remain tight for the rest of the year.”
Figure 1 Amount of farmland publicly marketed in England (acres)
NB Figures are for whole years unless otherwise stated and are rounded to the nearest 100 acres. Privately marketed farmland has been excluded due to the difficulty of collecting comprehensive information.
| East Midlands | East of England | North East | North West | South East | South West | West Midlands | Yorkshire and Humber | England | |
| Q1 & Q2 2018 | 7,800 | 11,200 | 3,200 | 1,200 | 6,000 | 5,600 | 4,100 | 3,500 | 42,700 |
| Q1 & Q2 2019 | 3,900 | 5,600 | 6,700 | 3,000 | 4,400 | 12,700 | 3,500 | 5,400 | 45,300 |
| Q1 & Q2 2020 | 2,800 | 5,700 | 600 | 2,600 | 3,400 | 7,500 | 2,000 | 1,000 | 25,500 |
| Q1 & Q2 2021 | 5,200 | 5,900 | 1,700 | 9,100 | 5,000 | 6,200 | 1,900 | 4,000 | 38,900 |
| Q1 & Q2 2022 | 1,900 | 14,500 | 3,400 | 5,300 | 5,900 | 3,600 | 2,200 | 6,500 | 43,400 |
| Five-year ave | 4,320 | 8,580 | 3,120 | 4,240 | 4,940 | 7,120 | 2,740 | 4,080 | 39,160 |
| % diff from ave | -56% | 69% | 9% | 25% | 19% | -49% | -20% | 59% | 11% |